Pro-AV Business Index
December remains stable even with seasonal trends

Highlights
The AV Sales Index (AVI-S) for December is 56.5, slightly down from 57.2. Specific industries like education and live events are experiencing an expected seasonal slowdown. That said, 2025's AVI-S is 3.4 points higher than 2024.
Throughout the year, the Pro AV industry has contended with challenges such as supply chain disruptions and increased tariffs, which have influenced purchasing decisions and project timelines. Additionally, global economic uncertainties and fluctuating consumer confidence have created a complex business environment. Nevertheless, the industry's focus on innovation and adaptation, such as integrating AI-driven technologies and supporting hybrid work environments, continues to drive demand and sustain growth.
The AV Employment Index (AVI-E) decreased by 1.4 points to 55.4, which remains above the 2024 index of 51.6, indicating a stronger employment market compared to the previous year. The unemployment rate remained stable in December at 4.6%, consistent with November levels, suggesting a balanced job market. This stability reflects ongoing demand for skilled AV professionals, although broader economic factors like inflation and geopolitical tensions continue to influence hiring trends.
International Outlook
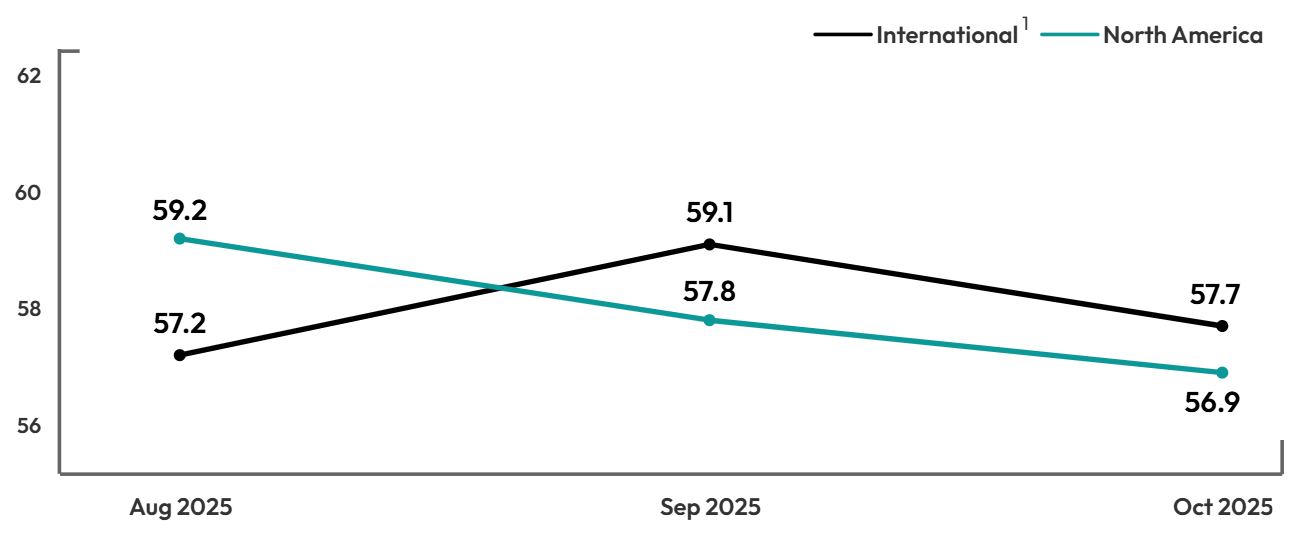
Despite fluctuating conditions, the North American AVI-S consistently remained above 50, demonstrating resilience and overall growth across the region throughout the year. The non-U.S. sales index also maintained steady growth, with the preliminary December sales index at 60.2, reflecting strong demand and positive sentiment from international companies.

1Due to the small sample, the North American and International indexes are based on a 3-month moving average. The December 2025 index is preliminary, based on the average of December rand November 2025 and will be final with January 2026 data in the next report.
1AVIXA®, the Audiovisual and Integrated Experience Association, has published the monthly Pro AV Business Index since September 2016, gauging sales and employment indicators for the pro AV industry. The index is calculated from a monthly survey that tracks trends. Two diffusion indexes are created using the survey: the AV Sales Index (AVI-S) and AV Employment Index (AVI-E). The diffusion indexes are calculated based on the positive response frequency from those who indicated their business had a 5% or more increase in billings/sales from the prior month plus half of the neutral response. An index of 50 indicates firms saw no increase or decline in business activity; more than 50 indicates an increase, while less than 50 indicates a decrease.
December is a quieter time for us, we specialize in supporting the live events and themed attractions markets, both are usually busy with holiday preparations and not looking to do major upgrades, just maintaining their current offerings, we tend to get busier 1st quarter as seasonal attractions are closed and more available for upgrades and ongoing maintenance.
AV Provider, North America
We are finishing a very challenging year, much uncertainty, tariffs that raise cost of AV products and we are facing the worst federal government ever.
AV Provider, Latin America
Macroeconomic uncertainty has led to more cautious spending, affecting purchasing timelines and deal sizes.
AV Provider, North America
Methodology
The survey behind the AVIXA Pro AV Business Index was fielded to 2,000 members of the AVIXA Insights Community between December 29, 2025 and January 6, 2025. A total of 287 AV professionals completed the survey. Only respondents who are service providers and said they were “moderately” to “extremely” familiar with their company’s business conditions were factored in index calculations. The AV Sales and AV Employment Indexes are computed as diffusion indexes. The monthly score is calculated as the percentage of firms reporting a significant increase plus half the percentage of firms reporting no change. Comparisons are always made to the previous month. Diffusion indexes, typically centered at a score of 50, are used frequently to measure change in economic activity. If an equal share of firms reports an increase as reports a decrease, the score for that month will be 50. A score higher than 50 indicates that firms, in the aggregate, are reporting an increase in activity that month compared to the previous month. In contrast, a score lower than 50 is a decrease in activity.
About the AVIXA Insights Community
The AVIXA AV Intelligence Panel (AVIP) is now part of AVIXA’s Insights Community, a research group of industry volunteers willing to share their insights on a regular basis to create actionable information. Members of the community are asked to participate in a short, two-to-three-minute monthly survey designed to gauge business sentiment and trends in the AV industry. Community members will also have the opportunity to participate in discussions, polls and surveys.
Community members will be eligible to:
- Earn points toward online gift cards
- Receive free copies of selected market research
- Engage directly with AVIXA's market intelligence team to help guide research
- Ask and answer other industry professionals' questions
The Insights Community is designed to be a global group, representative of the entire commercial AV value chain. AVIXA invites AV integrators, consultants, manufacturers, distributors, resellers, live events professionals, and AV technology managers to get involved. If you would like to join the community, enjoy benefits, and share your insights with the AV industry, please apply here


